By David Bauders, CEO of SPARXiQ and Trade Hounds
The Whale Curve: A Hidden Reality
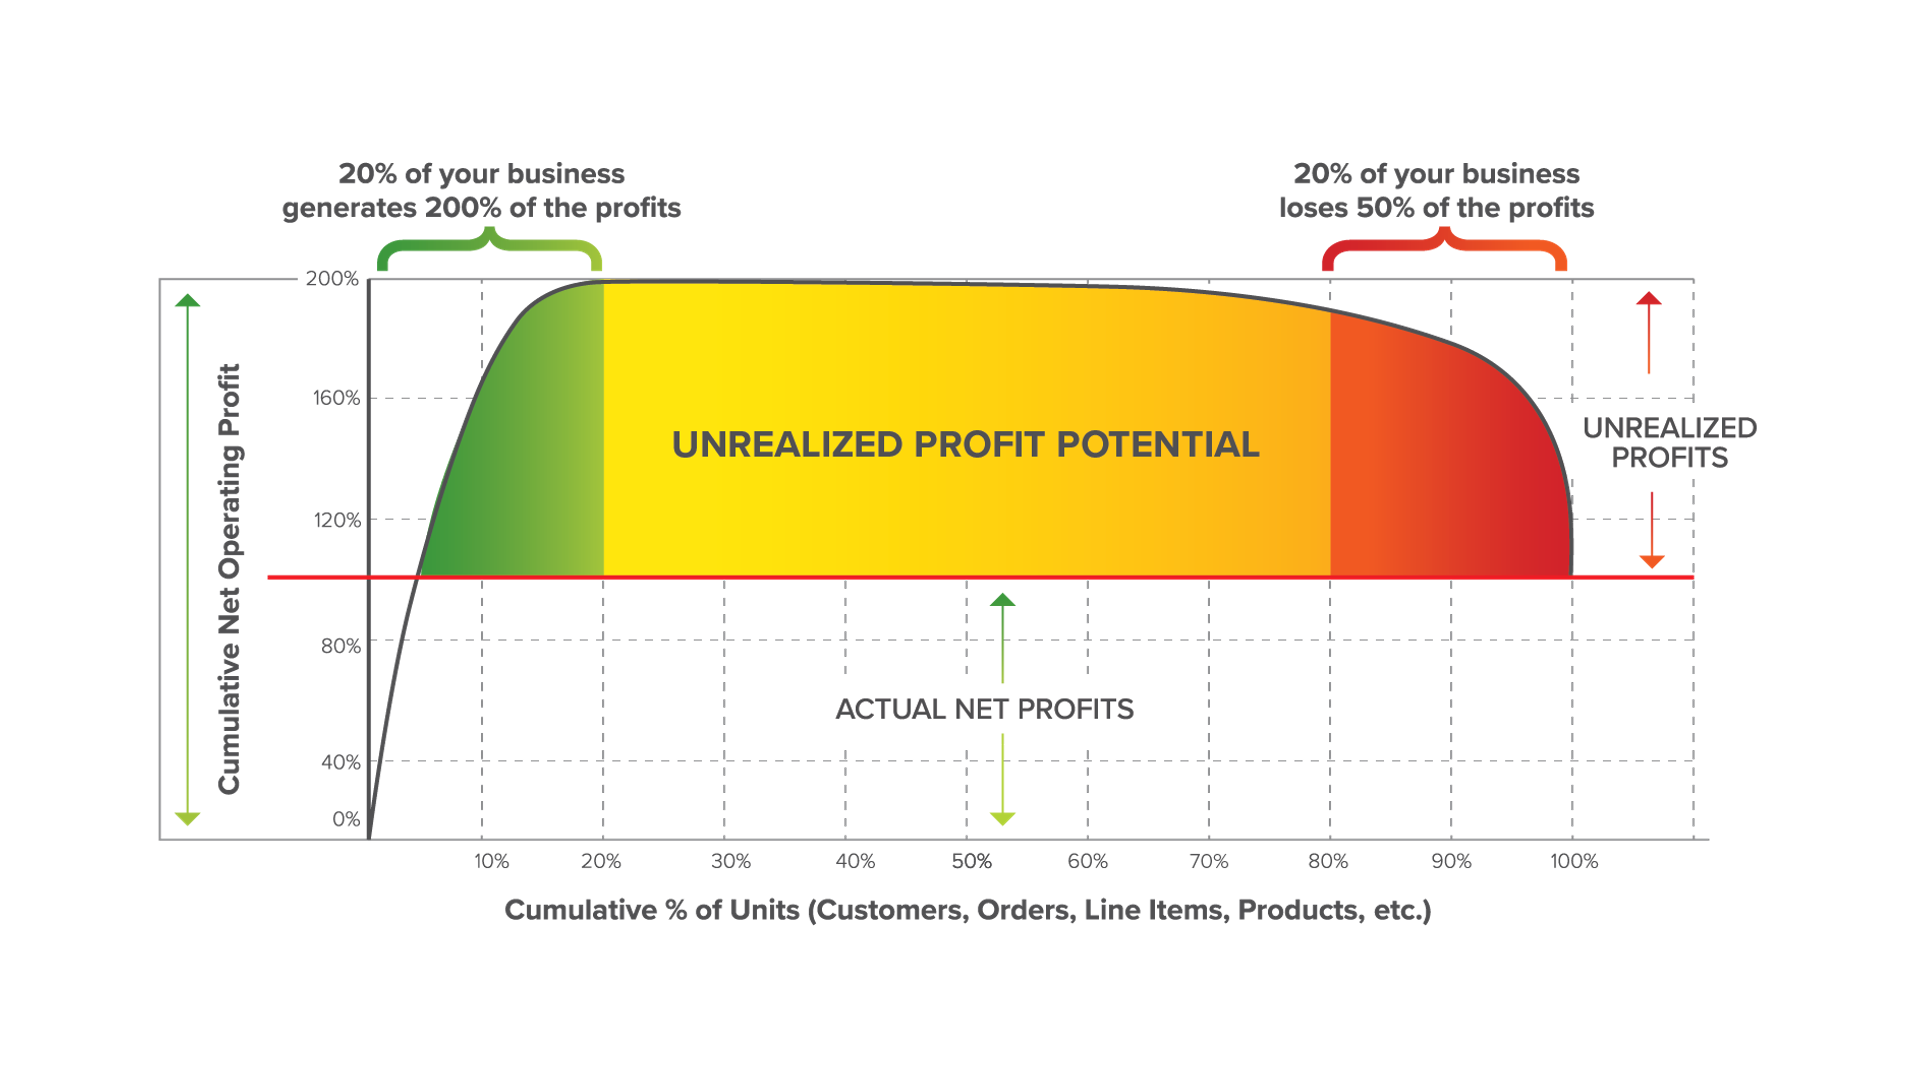
In most distributors, 20–30 percent of customers generate 150–200 percent of total net profit. The middle cohort breaks even. And the bottom 30–50 percent systematically destroy value—often to the tune of 50–100 percent of profits.
The reasons are structural:
- Pricing leakage. Discounts that erode margin well beyond cost-to-serve.
- Service intensity. High-touch service applied indiscriminately across large and small accounts.
- Rebates and incentives. Misaligned programs that reward volume, not profitability.
- Operational inefficiencies. Manual processes in quoting, order management, and invoicing that eat into thin margins.
The whale curve tells a sobering truth: not all revenue is good revenue. Growth without discipline often leads to scaling losses rather than scaling profits.
Why It’s Been Hard to Fix
If the whale curve is so well-known, why hasn’t the industry solved it? Three main obstacles stand out:
1. Data Blindness. Customer and product profitability data has historically been fragmented across ERP systems, spreadsheets, and P&Ls. Few distributors have the analytical clarity to see which accounts actually make or lose money.
2. Behavioral Inertia. Sales teams are wired for top-line growth, not bottom-line contribution. Comp structures, culture, and legacy practices reward volume and relationships, often at the expense of profitability.
3. Execution Complexity. Even with insights in hand, the challenge is operationalizing corrective action—re-pricing, re-segmenting, or re-servicing thousands of customers in real time.
Until now, the whale curve has remained a strategic talking point, but rarely an operational playbook.
Enter AI: From Retrospective to Prescriptive
Artificial intelligence changes the game in three profound ways:
1. Data Integration. AI systems can ingest ERP invoices, P&Ls, rebate data, vendor costs, and even unstructured communications, stitching them into a unified profitability model. What once required months of analyst work can now be automated in days.
2. Profitability Diagnostics. Advanced models can not only show who is profitable or unprofitable but also why. They can decompose margin leakage into pricing errors, rebate misalignment, service intensity, or cost allocation.
3. Actionable Recommendations. Agentic AI doesn’t stop at diagnosis. It generates specific, context-aware actions: adjust this customer’s pricing by 2.5 percent, move this account to e-commerce self-service, or renegotiate this vendor rebate. Crucially, AI can embed these recommendations directly into sales playbooks, quoting systems, and rep workflows.
This is the leap from retrospective reporting to prescriptive, real-time guidance.
The Three Levers of AI-Driven Profitability
Distributors can harness AI across three high-leverage areas of the whale curve:
1. Pricing Discipline
Pricing leakage is the single largest destroyer of profitability. AI can continuously monitor invoice data, flag non-compliant discounts, and recommend optimal pricing bands by product family, geography, and customer type. Instead of blunt, across-the-board increases, AI enables precise micro-adjustments that preserve competitive position while recapturing margin points.
2. Cost-to-Serve Alignment
AI can model the true cost-to-serve across activities—field sales visits, customer service calls, deliveries, returns—and allocate them accurately to customers. This makes visible the hidden subsidy of unprofitable accounts. AI can then recommend channel shifts: moving small-order customers to inside sales or e-commerce, consolidating deliveries, or introducing fees for high-cost services.
3. Rebate and Vendor Optimization
Rebate programs often incentivize volume over profitability. AI can evaluate whether chasing a rebate tier actually improves net profit or just adds unprofitable sales. Similarly, it can identify vendor SKUs where margin support is misaligned with demand, creating negotiation leverage for distributors.
From Curve to Compass
The whale curve should not be a static chart shown once a year in boardrooms. With AI, it becomes a dynamic, daily compass guiding frontline behavior.
- For executives, AI provides a clear map of where profits are created and destroyed.
- For sales reps, it delivers smart nudges—pricing guardrails, account strategy cues, and profitability insights—right at the moment of customer interaction.
- For operations, it highlights workflow bottlenecks and service cost mismatches, enabling resource allocation by profit potential.
This integration transforms the whale curve from a post-mortem into a living operating system for profitable growth.
Case in Point: Turning Tails into Heads
Consider a distributor that analyzed its whale curve and found 40 percent of accounts were losing money. Historically, this insight stalled—sales leadership resisted tough calls, and systems lacked integration.
By layering AI:
- They identified “hidden gold” accounts with modest revenue but strong margin potential. Re-pricing and right-servicing converted many from negative to positive contribution.
- They redeployed outside sales from low-profit “tail” accounts to high-growth, high-margin “head” accounts.
- They introduced delivery minimums and service fees to align cost-to-serve.
Within 12 months, the whale curve reshaped: tail losses shrank dramatically, and net profitability grew by double digits—without adding new revenue.
Cultural Transformation: Beyond the Math
AI is not just a technical tool; it catalyzes cultural change. When profitability data is democratized and delivered in real time, excuses evaporate. Sales teams can no longer hide behind top-line growth when net profit impact is visible on every deal.
Moreover, AI empowers a shift in narrative: from “cutting customers” to “growing profitably.” Tail accounts are not written off; they are given clear, AI-guided paths to profitability—whether through pricing, channel migration, or service redesign. This reframing builds buy-in across the organization.
A Strategic Imperative
For distributors facing margin compression, labor shortages, and rising digital competition, mastering the whale curve is not optional. It is the difference between compounding profitability and compounding risk.
AI is the lever that finally makes whale curve management systematic, scalable, and real-time. It turns a familiar shape on a slide into a strategic operating discipline.
Those who act now will not only accelerate profitability but also future-proof their organizations. Those who don’t risk being trapped on the wrong end of the whale.
Closing Thought
The whale curve reminds us that in distribution, size is not destiny—profitability is. AI gives us the clarity, speed, and precision to rebalance our portfolios toward profitable growth. The question is no longer whether you have a whale curve. The question is: will you harness AI to reshape it before your competitors do?

About the Author
David Bauders is the CEO of SPARXiQ, which he founded in 1993 to help companies accelerate sales and profitability with the right analytics, tools, and complementary skills training. He also serves as CEO of Trade Hounds, the largest social community for the construction industry.