

Economic Trends
U.S. Construction Spending Posts Unexpected Sharp September Decline
November 2, 2026


Economic Trends
U.S. durable goods orders increased 10.0% year-over-year as transportation equipment led September’s monthly gain. Overall factory orders rose 1.8%, with nondurable goods orders also advancing. Get the breakdown here of how each durable goods category moved MoM and YoY.
New orders for U.S. manufactured durable goods increased 1.9% in September from August to $345.7 billion, putting them 10.0% above a year earlier, according to the Census Bureau’s monthly full report released Nov. 3.
The durable goods increase followed a revised 0.1% gain in August. September shipments rose 0.9% to $336.9 billion, up 9.4% year-over-year.
Across all manufacturing industries, new orders increased 1.8% to $677.2 billion — their third consecutive monthly increase — following August’s 0.3% gain. Total orders were up 10.5% year-over-year.
Transportation equipment led September’s durable goods orders increase, rising 4.6% to $119.9 billion. Nondefense aircraft and parts orders jumped 28.3%. Excluding transportation equipment, durable goods orders increased 0.5% from August.
Machinery orders rose 1.5%, including gains of 7.8% for industrial machinery and 2.3% for ventilation, heating, air-conditioning and refrigeration equipment. Construction machinery orders fell 4.7%, while metalworking machinery orders declined 2.9%.
Primary metals orders increased 0.4% and fabricated metal products orders rose 0.5%. Orders for electrical equipment, appliances and components declined 0.3%.
Nondurable goods orders and shipments both increased 1.8% to $331.6 billion, up 11.0% year-over-year. Petroleum and coal products shipments rose 5.2% from August, while chemical products shipments increased 2.0%.
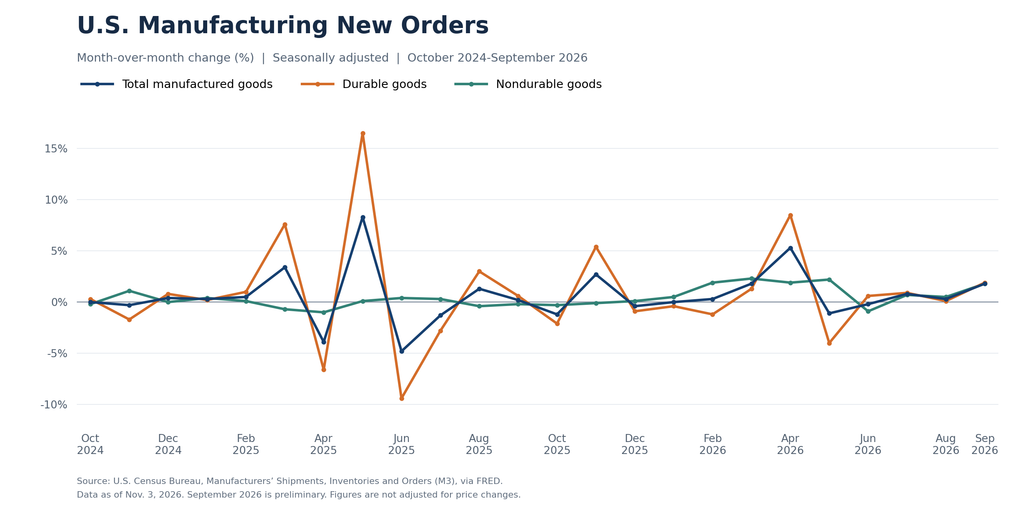
Total manufacturing shipments increased 1.3% to $668.5 billion, their 11th increase in the past 12 months, and were up 10.2% year-over-year.
Unfilled orders increased 0.9% to $1.624 trillion. Inventories rose 0.4% to $976.0 billion, marking their 12th consecutive monthly increase. The inventories-to-shipments ratio declined to 1.46 from 1.47 in August.
Percent change, seasonally adjusted. MoM compares September with August 2026; YoY compares September 2026 with September 2025.
| Product category | Orders MoM | Orders YoY | Shipments MoM | Shipments YoY |
|---|---|---|---|---|
| Durable goods total | +1.9% | +10.0% | +0.9% | +9.4% |
| Wood products | — | — | +0.1% | +2.2% |
| Nonmetallic mineral products | — | — | -0.5% | +1.8% |
| Primary metals | +0.4% | +20.3% | +0.4% | +17.8% |
| Iron and steel mills | +2.4% | +21.2% | +1.8% | +18.4% |
| Aluminum and nonferrous metals | -1.9% | +19.5% | -1.6% | +17.1% |
| Ferrous metal foundries | -2.1% | +17.7% | +0.4% | +17.7% |
| Fabricated metal products | +0.5% | +8.6% | +0.3% | +7.5% |
| Machinery | +1.5% | +16.3% | +1.6% | +13.6% |
| Construction machinery | -4.7% | +1.2% | +0.2% | +1.6% |
| Mining, oil field and gas field machinery | +0.9% | +49.8% | +4.3% | +29.0% |
| Industrial machinery | +7.8% | +47.1% | +4.8% | +37.0% |
| HVAC and refrigeration equipment | +2.3% | +16.2% | +0.9% | +19.8% |
| Metalworking machinery | -2.9% | +6.1% | -1.8% | +5.5% |
| Turbines, generators and other power transmission equipment | -1.4% | +22.4% | +4.6% | +23.2% |
| Material handling equipment | -0.4% | +11.3% | +1.2% | +3.2% |
| Computers and electronic products | +0.8% | +16.7% | +1.4% | +9.7% |
| Electrical equipment, appliances and components | -0.3% | +4.8% | 0.0% | +5.9% |
| Electric lighting equipment | -2.2% | +10.3% | +1.8% | +13.1% |
| Household appliances | -0.9% | -3.1% | -0.2% | -3.5% |
| Electrical equipment | +2.9% | +3.2% | +0.1% | +3.7% |
| Transportation equipment | +4.6% | +8.0% | +1.5% | +9.8% |
| Nondefense aircraft and parts | +28.3% | +16.0% | +3.3% | -0.7% |
| Furniture and related products | -0.3% | +1.3% | -0.4% | +1.1% |
| Miscellaneous durable goods | — | — | +0.6% | +7.9% |
Stay Informed
News, trends, and analysis for wholesale distribution leaders. Free, everyday.
Subscribe to MDM Update