




Economic Trends
June U.S. Container Imports Down 16% YoY, Top Pre-Pandemic
Compared with 2022, TEU volume was down 16.1% in June, but up 6.0% from pre-pandemic June 2019, according to Descartes.

The goods and services deficit was $80.7 billion in December, up $1.4 billion from $79.3 billion in November, revised, according to the U.S. Census Bureau and the U.S. Bureau of Economic Analysis.
In June, U.S. container import volumes decreased slightly 0.7% from May to 2,081,793 twenty-foot equivalent units (TEUs), according to Descartes. Compared with the same month last year, TEU volume was down 16.1%, but up 6.0% from pre-pandemic June 2019.
The growth in import volume in June accelerated past 2019 volumes by 2.1% for the same period in each year.
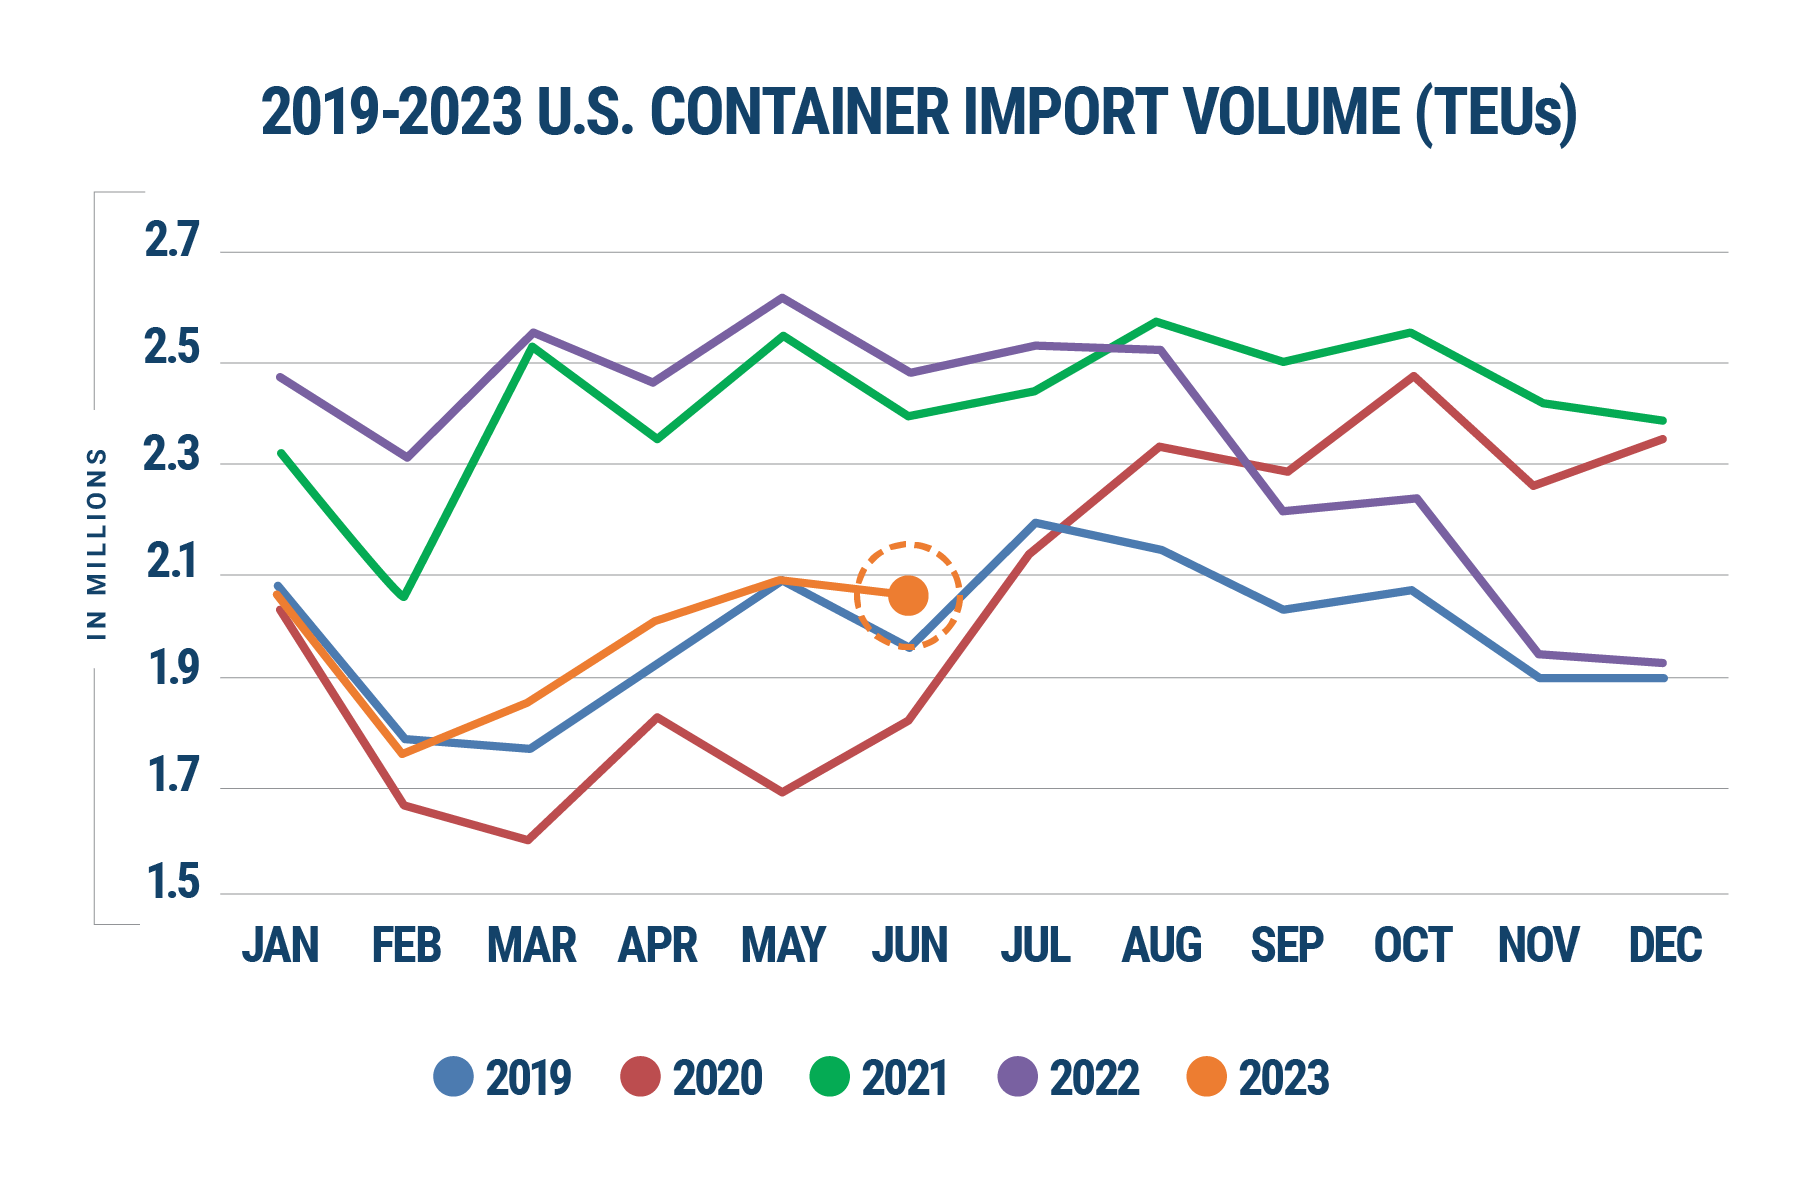
“Examining the increase in import volumes from May to June in the previous six years, apart from 2020, which was an anomaly, June 2023 volumes show the lowest decrease from May of the same year,” Descartes reported.
Quick Facts from Descartes’ Report:
- 7 of the top 10 ports in the U.S. reported May to June decreases in container import volume.
- The Port of Los Angeles showed the greatest overall container volume increase (32,486 TEUs) in June, but the Port of Long Beach had the greatest percentage decrease (-15,294).
- Chinese imports in June 2023 climbed 0.3% over May 2023 to 783,019 TEUs, but still down 22.0% from the August 2022 high.
- China represented 37.6% of the total U.S. container imports in June, an increase of 0.4% from May, but still down 3.9% from the high of 41.5% in February 2022.