





Economic Trends
September U.S. Industrial Production Tops Expectations
A spike in utilities output drove much of the increase, while manufacturing also had a healthy finish to 3Q26.
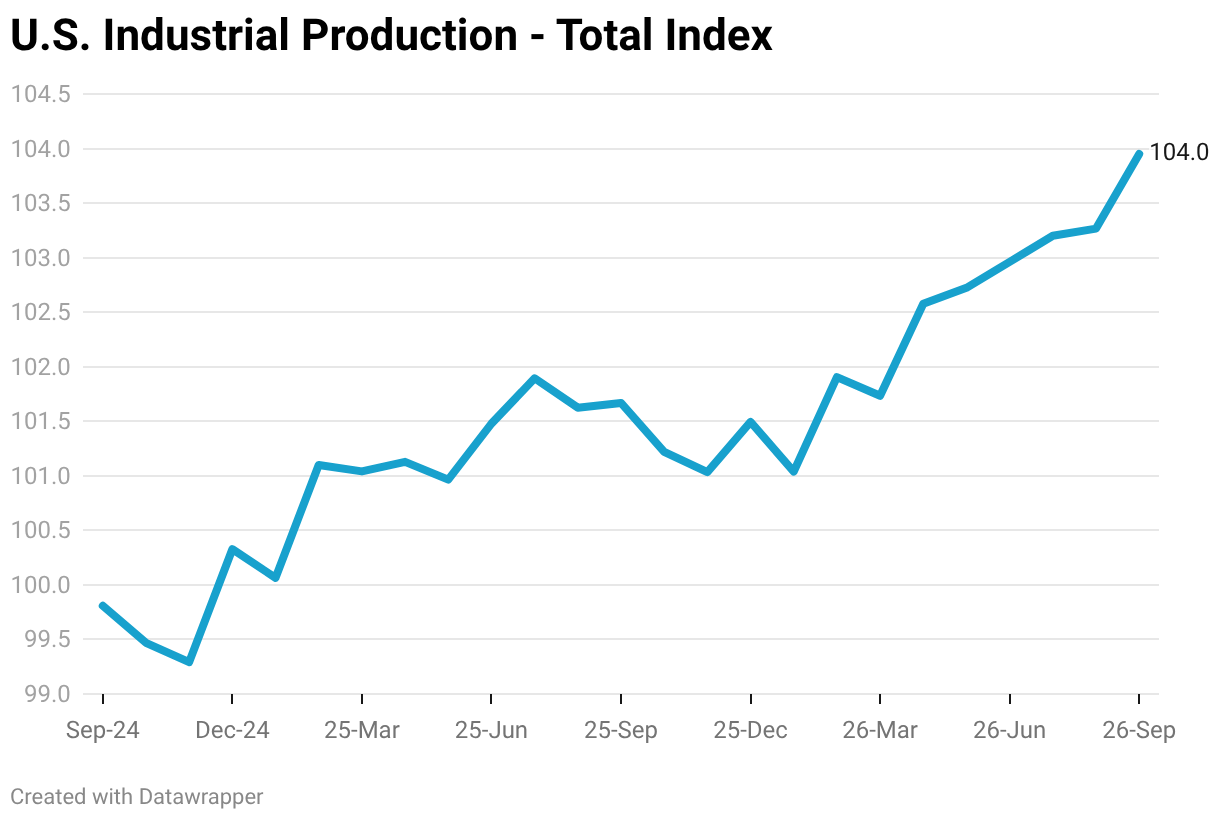
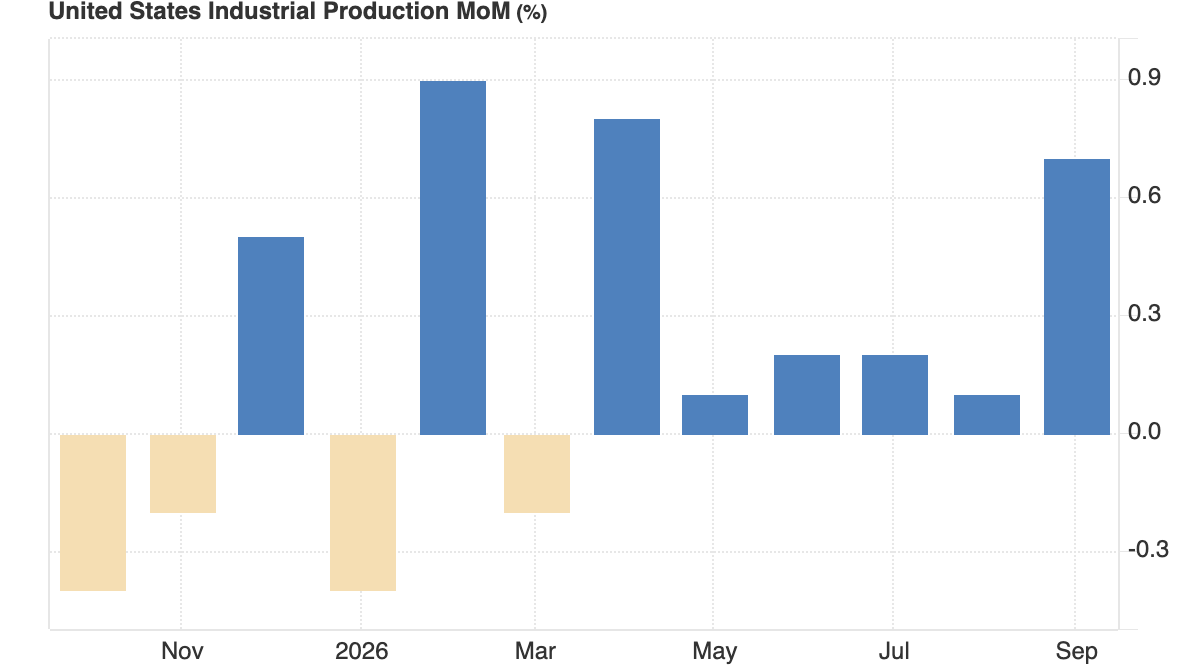
U.S. industrial production increased a healthy 0.7% month-over-month during September, according to the Federal Reserve’s monthly Industrial Production and Capacity Utilization Report.
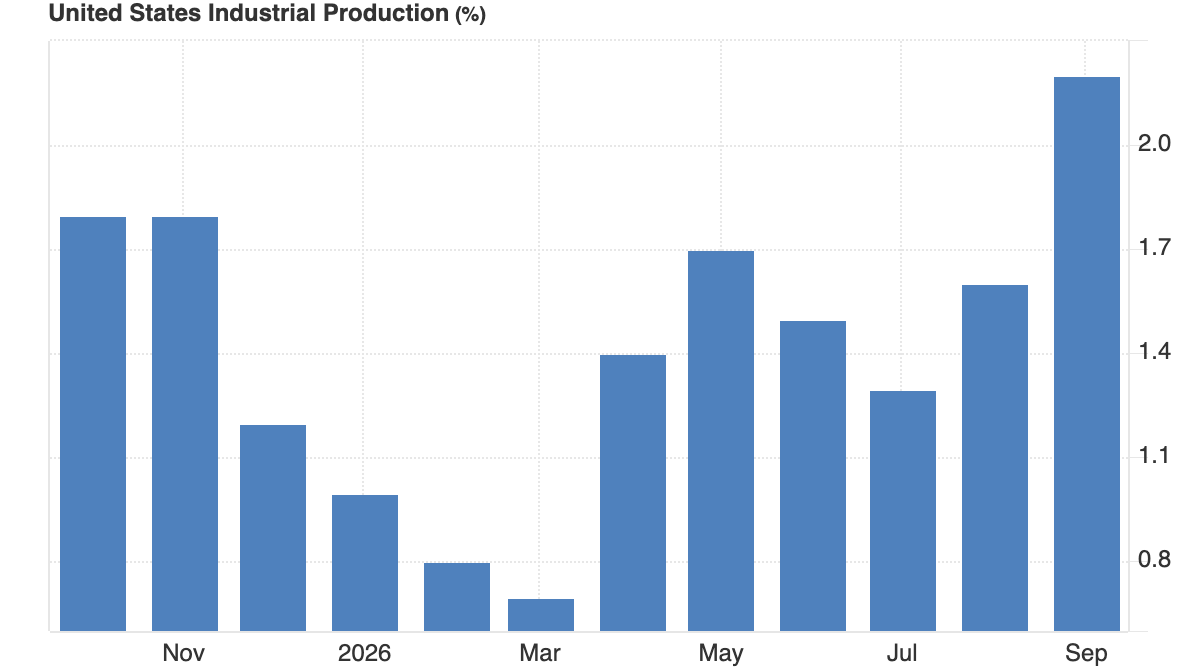
That figure outperformed market expectations of a 0.4% gain. On an annual basis, production increased 2.2%.
September’s monthly figure far surpassed August’s unrevised 0.1% gain (July and June both +0.2%).
The report showed that September manufacturing output improved 0.3% month-over-month — in line with market expectations following a revised 0.2% decline in August (up from -0.3%). Annually, manufacturing production was up 1.1%.
Utilities drove much of the topline IP gain with a 3.5% monthly jump in September after a 1.5% August increase. Annually, utilities production was up 8.7%.
Mining output increased 0.2% in September after a 0.5% August gain and was up 2.8% year-over-year.
Meanwhile, U.S. industrial capacity utilization moved up to 76.9% in September — up 0.5 points from August and up 1.2 points year-over-year. The September rate was 2.5 points below its long-run average.
Market Groups
All major market groups posted gains in September except business equipment, which recorded no change. The production of consumer goods rose 0.7 percent, as a gain in nondurable consumer goods output more than offset a decline in durable consumer goods output. Output of defense and space equipment rose 0.4 percent. The index for construction supplies increased 1.0 percent, and the index for business supplies rose 0.9 percent. Materials output moved up 0.7 percent, with gains in its energy and non-energy components.
Industry Groups
Manufacturing output rose 0.3% in September and increased at an annual rate of 0.7% in the third quarter. The durable manufacturing index ticked up 0.1% in September. Within durables, gains of 1% or more were posted by primary metals; machinery; and electrical equipment, appliances, and components. Output of motor vehicles and parts declined 3.0%. The nondurable manufacturing index increased 0.4%, led by gains in the indexes for printing and support and for chemicals. In the third quarter as a whole, durable manufacturing output rose at an annual rate of 3.8% — driven in part by a 28.4% gain in the output of semiconductors and related electronic components — while nondurable manufacturing output fell 1.6%.
Mining output moved up 0.2% in September and expanded at an annual rate of 5.0% in the third quarter. The index for utilities rose 3.5% in September, with gains in the indexes for electric utilities and for natural gas utilities. In the third quarter, utilities output increased at an annual rate of 14.8%.
Capacity utilization for manufacturing increased 0.1 percentage point in September to 75.9%, a rate that is 2.3 points below its long-run (1972–2025) average. The operating rate for mining ticked up 0.1 point to 87.5% in September, and the operating rate for utilities increased 2.3 points to 73.8%. The rate for mining was 2.3 points above its long-run average, while the rate for utilities remained substantially below its long-run average.